
Tutorial on how to use the geoscience plugin to build quality sections

a couple of weeks ago, I wrote an article about creating quality digital cross sections using only the QGIS interface. This is done via digitising polygons and lines over desurveyed drill data generated via the geoscience plugin (credit to Roland Hill who created it). Whilst this is an easy process, there are plenty of bumps on the way dealing with small bugs and advanced digitisation tricks that I would like to share with you so you can follow an optimised workflow from the start. I am assuming you already have the required plugin and you know what it is. If not, I invite you to read this before you continue. Without further due, let’s dive in..
General requirements
You will need the following toolbars to be enabled so you can follow this process

Digitizing tools
Advanced digitizing
Shape digitizing
Selection
Snapping
Label
Data export
This assumes you are sourcing it from a database. If you are not, just skip this first paragraph. If you are, you will find it easy to set up a series of queries now that you can use again later for different projects. If you are using MS Access for example, an initial query defining the project area boundaries can be connected to other queries to extract your corresponding downhole (DH) data (collars, surveys, assays, lithology, alteration, veining, structure, etc). When I first started, I tended to use my own names for the queries, but I wouldn’t advise this. Through experience I soon found that it really is best to stick to the naming conventions that are already established in your database. e.g. ‘qry_ QGIS_ SectionBuilder_ Export_Area’; and prefix ‘qry_QGIS_SectionBuilder’ for the other queries.
Export or save your data tables as CSV files. You should at the minimum have a collar and survey table. Some fields are necessary and are listed below:
Hole ID (make sure they are consistent throughout all tables)
Easting / Northing
Elevation
Ideally, you would like to display some data on those traces so throw in any DH data you think will be useful. If you have surface data, populate elevation values for each entry so you can display those on your sections. You are ready for the next step once you have gathered all your tables and put them in the root of your GIS project.
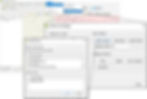
Data import
First, make sure your QGIS project is in the correct CRS, as changing it midway will make the plugin unhappy. From now on make sure all the files you work with are in the same projection, including the raster DEM if you are using one. Drag and drop all your tables into the GIS. Then run the ‘Create points layer from table’. Save the resulting layer as a geopackage file.
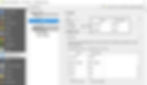
Desurvey holes
Go to geoscience plugin -> Drilling -> Desurvey Holes. Populate the fields in the pop-up window. Leave Azimuth and Dip from the collars blank, as you will be using the ones from the survey table. Check your survey dip, is it negative or positive? The resulting layers are the DH traces and the “3D” collars, which should be used from now on. They are already saved as geopackage files in your root GIS folder and are named after your input files.

Before you carry on
Check if holes were ALL desurveyed
If you are missing holes, then delete layers and files, check your survey table, re-import and desurvey once more. There could be inconsistencies in your hole ID’s, or missing survey values.
If you can’t find the problem, then start from fresh in a new GIS workspace. Bugs happen sometimes.
Add downhole data
It is now time to desurvey your DH data along the hole traces that have just been created. Go to Geoscience plugin -> Drilling -> Downhole Data. Choose the table you want to load, add a meaningful file name suffix, and off you go! This process will also result in automatically saved and appropriately named geopackage files. Any DH data you desurvey will always be in the format of a line.

Before you carry on
Apply the ‘Refactor Fields’ tool to your DH data layers. This enables you to redefine all of your fields into their appropriate format. Decimal numbers (double) for all numerical data; and text (string) for categorical data. Doing it this way enables you to choose graduated symbology for your numerical data.
Symbolise
Go through your layers and apply the best symbology you can come up with. I personally believe symbology is very important, and for me having something well thought out visually reduces noise and helps in the interpretation. In brief, here is my advice on symbology:
Only create them once. Save the symbology as files so you can reuse them later
Group categories together to reduce them down to the essential
Use a “Flat” “Cap Style” in your individual symbol settings
Use symbol levels to your advantage

Before you carry on
Symbolise all your “Collar 3D”, DH traces, and DH data layers
Organise your layers, group them and get them in order. Their relative levels will be preserved when you create sections.
Make a section!
The time has come. Get your katana out. Go to geoscience plugin -> Drilling -> Section Manager. This will suggest pre-defined W-E and S-N orientations, or “Map Canvas” which lets you draw a section in any orientation you want. Section width is handy if you want to include holes out of the line you want to section. You can make longitudinal sections, but they would not be practical since you only have one fixed view.
Once you click on a new section button, a pop-up shows asking you to choose a section name and which data you want to show on it. This is the time to select your DH and surface data PointZ data. Also select a DEM if you have one, to have the topo line showing. If no topo shows, then check:
Your DEM is actually a DEM and single cells have elevation values assigned to them
Your raster file is in the same CRS as your QGIS project and other files. Warp it if you need to reproject it.
You should end up with a bunch of layers, which I’ll go into shortly.
Before you carry on
Create a new line layer, call it “Sections”, add a “name” field, and draw over your section line layers from the plugin. This avoids you losing the location of your section line when the ones from the plugin disappear after you close and reopen your GIS (yes, even if you save the scratch layer beforehand).
Save resulting temporary scratch layers as geopackage. Toolbox -> Package layers. Make sure to “Save layer styles into GeoPackage”.
Create map layout
If you want to export your section as an image, then you must create a map layout so you can export it with a legend. In the layout view, drag and zoom to the desired canvas extent. Pay attention to the scale you are working in, as all digitisation work will be carried out at this scale. If you digitise at a different scale than the one in your layout view, your output will be distorted. You can get the scale value in the map properties, still in the layout view.

Adjust grid lines
You may have noticed the “Decoration” layers in your section layer group. These are the X, Y, Z grid lines and the border outline of the section. I tend to keep the border as it is, but I remove some of the other lines. If your section has a dominant E-W, then remove the Y grid line, remove the X if your section is more N-S oriented. Also remove all unnecessary grid lines, you should only have two coordinate grid lines showing on your final output. I personally crop the lines, so only “ticks” remain. I personally think this looks much nicer on the final outputs. You can do this very quickly using the split tool. For those who aren’t familiar with it, you can find it in the advanced digitisation toolbar.

Create interpretation layers
Before you can start drawing and interpreting, you need the right digitising tool. I usually have:
A line layer for interfaces:
contacts
alteration zone boundaries
faults
base of complete oxidation
top of fresh rock
water depth, etc
A polygon layer:
Lithology
Alteration
Mineralised zones, etc
So go ahead and create two GeoPackage files. Make sure they contain attribute fields that you can fill as you digitise. Preferably, make those fields “value Map” widgets so you can pre-fill attributes and pick them from a dropdown list when you add new features. This makes everything consistent and quicker.
Drawing interpretation
All projects are different but here are the general steps you can follow:
- Check your scale before digitising -
draw all your interfaces before everything else
Start by drawing regolith interfaces from your DH regolith data. If your logs are poor quality, you can generally rely on colour for upper and lower saprolite.
Draw lithological and alteration contacts. Veining zone boundaries if you are after veining, or anything else you want to show on your section
apply a smooth on your interface lines
draw polygons
use advanced snapping options, avoid overlap, and use tracing when convenient to do so. If you are not familiar with these advanced digitisation tools, I would advise you to get to know them well because they are extremely useful.

I usually display assays and veining directly on the trace, but you can draw them if you have large zones worth showing.
Symbolise your interpretation layers
I usually use rule-based symbology because I tend to symbolise using multiple fields. For example, if you want to show inferred and known domains for structures or lithology, alteration, etc.

Move your labels
The only way to label your section properly is to place them manually and individually. For this you need to use the label toolbar. You can then select, rotate, and move individual labels to where you want them.
Make sure Hole ID’s, grid coordinates, and elevation values are labelled. I like rotating the hole ID labels so they are in line with their corresponding hole trace. Assay data can be labelled on or next to the interval or aligned with call outs.

Sometimes this tool gets stuck and you cannot move or rotate labels anymore. This is because the move and rotate function works by creating geometry fields within the layer. When activated, it creates a X, Y, and a rotation value, which determines the spatial position of your label. The label manager sometimes fails to create those geometry fields, which make the labels stick and unresponsive to move and rotate. The way around that is to manually create X, Y and R fields for each layer you want to modify the labels for:
· X and Y must be decimal numbers (real)
· R can be a whole number (Integer)
Populate values by expressions:
· “x($geometry)” for the x field
· “y($geometry)” for the y field
· “0” for the R field
Then go to-> layer properties -> label -> placement -> data defined, and select the right field for X, Y and rotation. The label manager should be working fine now.
Polish off
Once you have all your elements, it’s time to finish off your project in the layout view. Make sure you have
A legend
A scale bar (although some would argue that is not needed since you have the grid ticks)
Added end points to your section so it can be georeferenced and brought up into a 3D modelling software if needed.
Orientation markers (E-W, SW-NE, etc)

Conclusion
So… no more exporting drill traces with an expensive 3D modelling package and drawing on them with a graphic design software. You now have access to a far more practical process and just like anything, once you have done it a few times it becomes quick. If you are working as a junior somewhere, go ahead, be the section person, and churn out some impressive figures for your reports. Quality sections can help enormously in demonstrating the potential of a target.
Equally, if you are a student, you can still use this great plugin to build sections using only your surface data.
I can't wait to see how easy it's going to get with the new OpenLog plugin from Oslandia!
Take care and have fun sectioning!
Dimitri


